

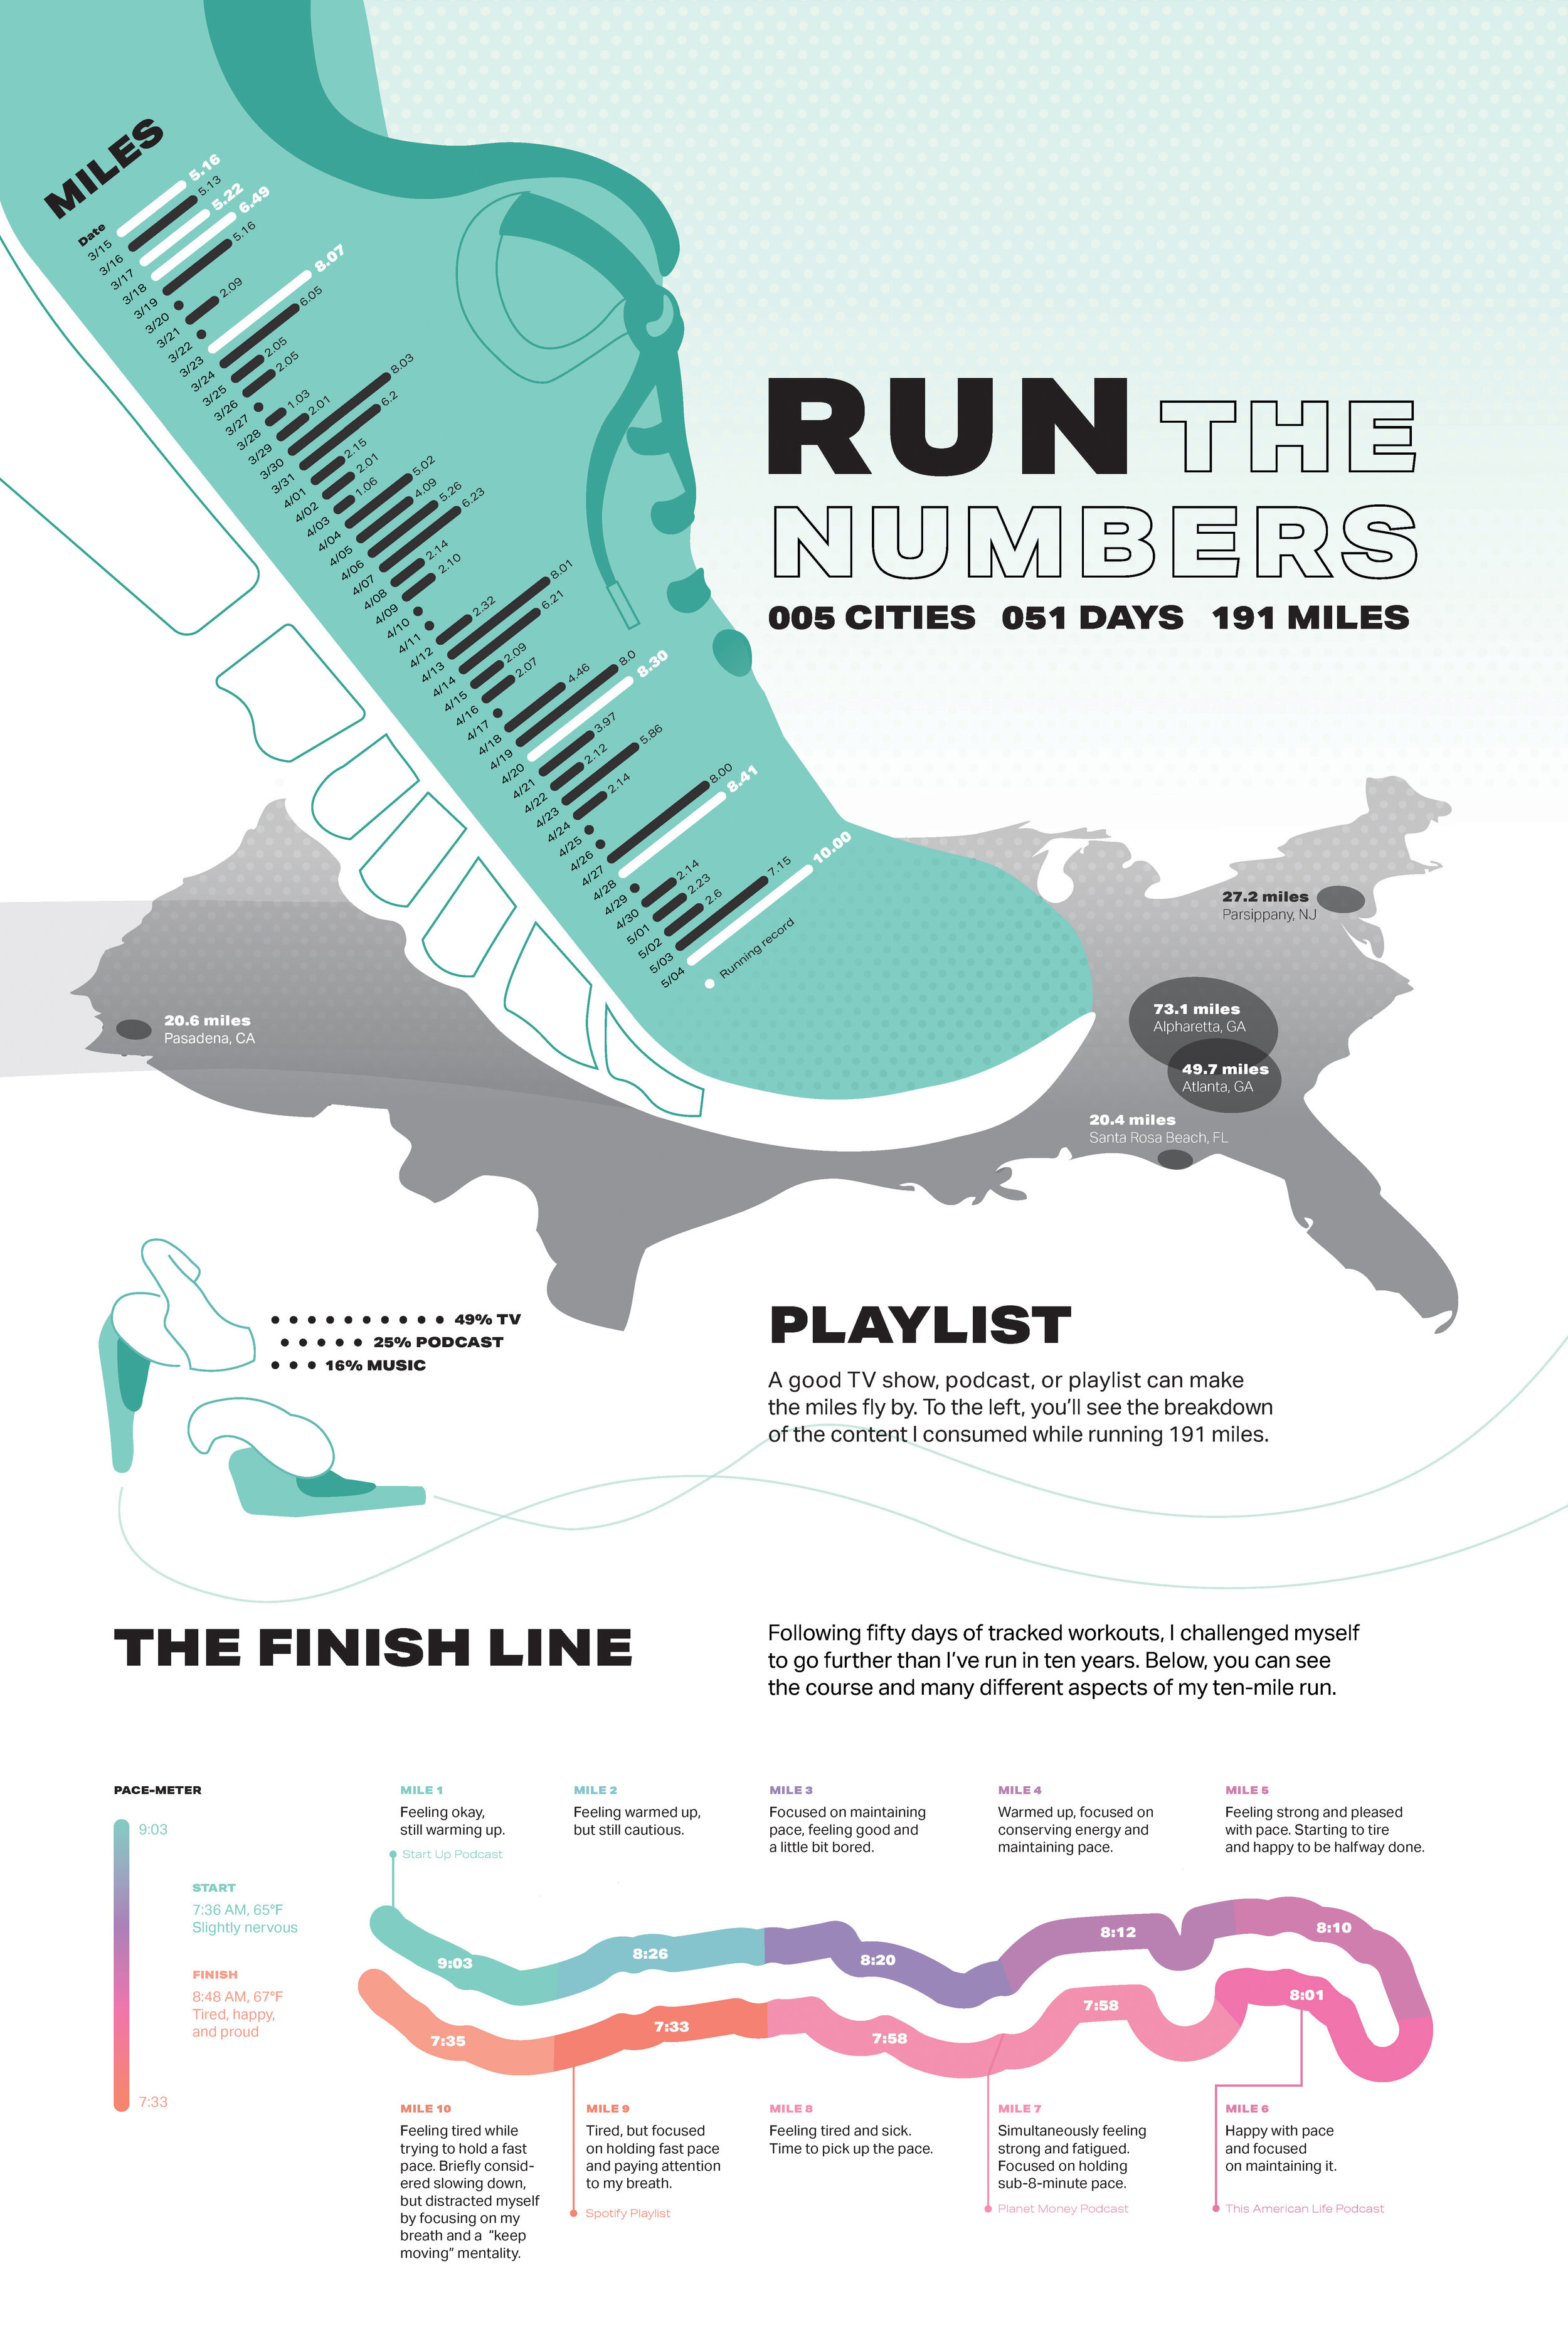
Over the span of fifty-one days, I ran 191 miles in five different cities. I tracked all of the data to create a visual representation of each and every mile.
Poster
This design visualizes many different aspects of each run. Based on the information graphics, you’ll be able to see when I set a running record, where I ran, what I listened to, and much more. Despite the wealth of information, the visual hierarchy will lead you through my running journey.
Interactive prototype
This digital experience allows users to explore my running journey in a non-linear fashion. I applied UX principles and developed design patterns to format the data in a clear and compelling composition.


